Monday, July 8
Analysis
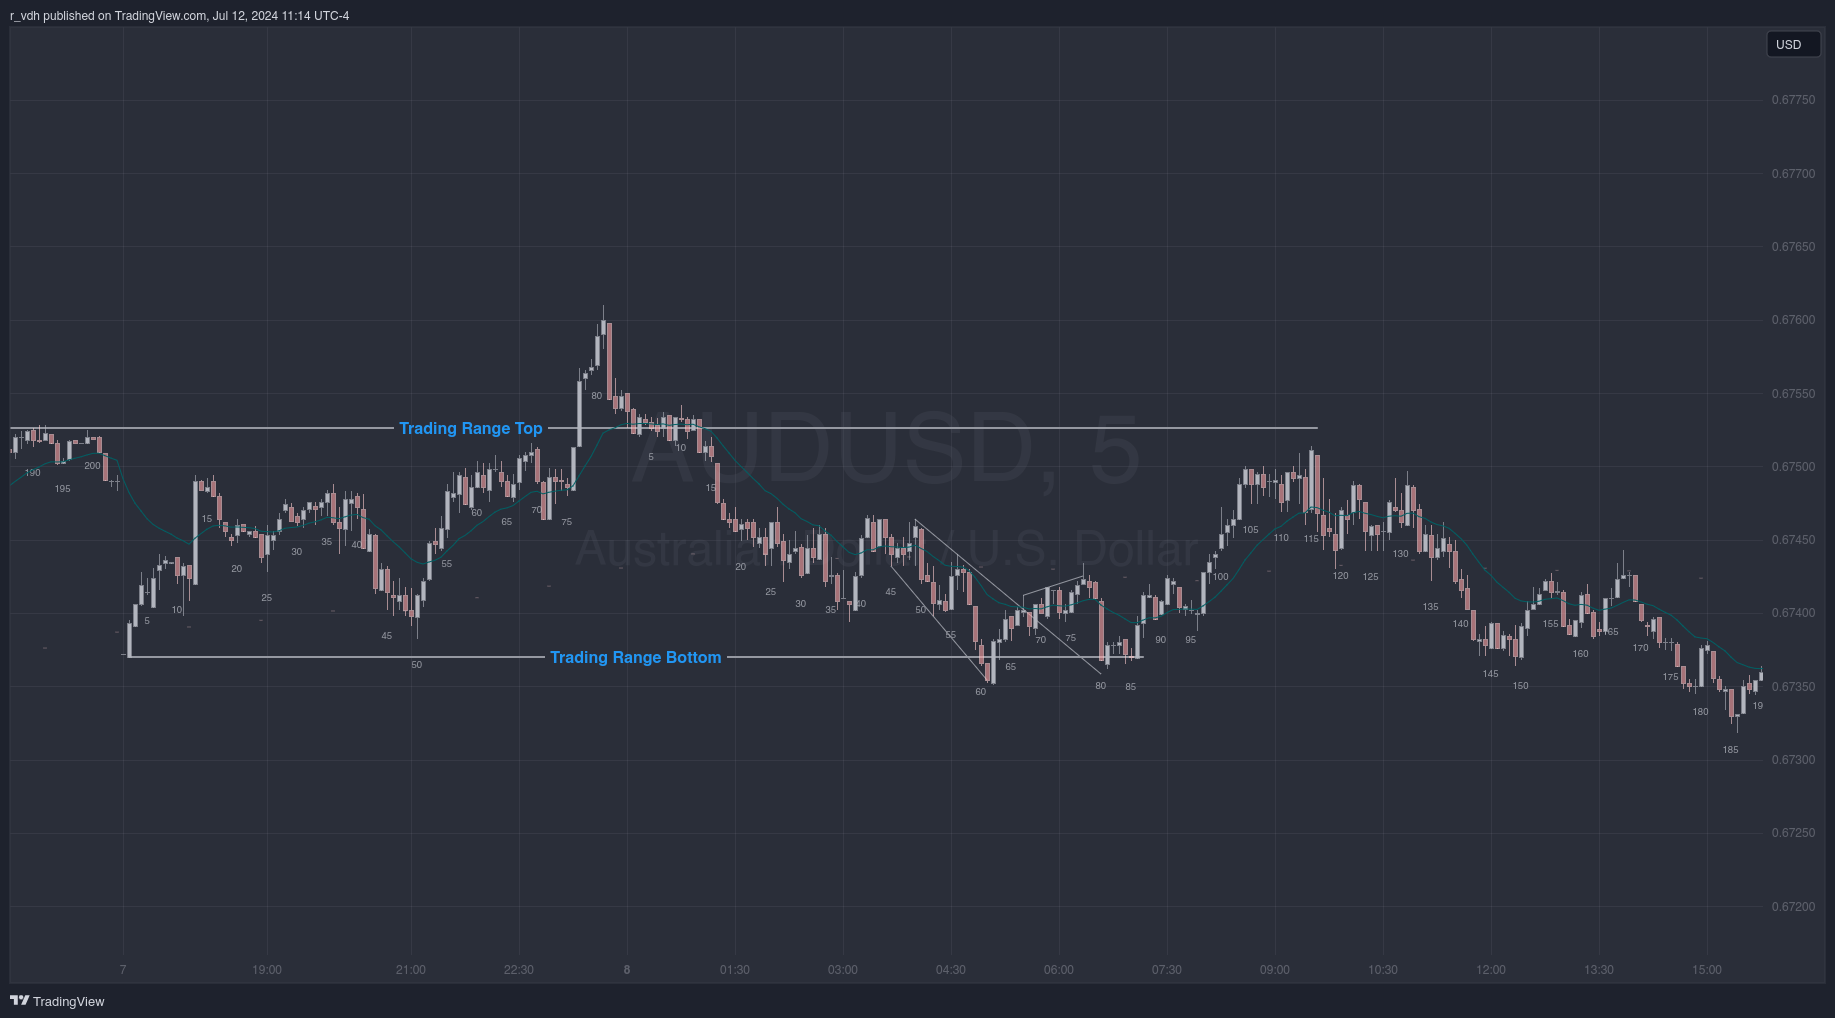
The price gapped down on Sunday afternoon at the open. The gap was climactic and the price then worked its way back up, managing to get above the trading range top before beginning the bear trend down to the bottom of the trading range.
Since we were in a trading range, the appropriate trading strategy was to sell high, buy low, and scalp. So I should be looking to sell in the top third of the trading range and to buy in the bottom third.
Today’s Bar 62 was a wedge bottom with a good reversal bar beneath the bottom of the trading range. While it may have been an acceptable trade on account of trend line break and moving average gap bar at bar 41, it also came on the heels of 5 bear trend bars, so waiting for a second entry may have been advisable.
After the bulls were able to make a clean break of the trend line and get two moving average gap bars at bars 72 and 77, three bear bars brought the market down to a higher low major trend reversal. With the exception of the very first bear bar of the trend at Sunday night’s bar 82, today’s bar 80 was the best looking bear bar of the trend. Because it occurred after the trend had gone on for over eighty bars, and it collapsed down to the bottom of the range, it was likely that the bar was a climax, and therefore made for a good buy-the-close trade. There was a double bottom with that bar four bars later, and an inside bar after the double bottom, the breakout of which would also have made for a probable trade.
A sell-the-close bull trend bar also occurred nearer the end of the session at bar 115. Similarly, it was the best looking bar of the bull trend up to the top (almost) of the trading range. While it didn’t touch the top of the range, it was in the top third. Using yesterday’s bar 81 high as the stop loss, instead of a measured move based on the height of bar 115, would likely have been preferable.
Tuesday, July 9
Analysis
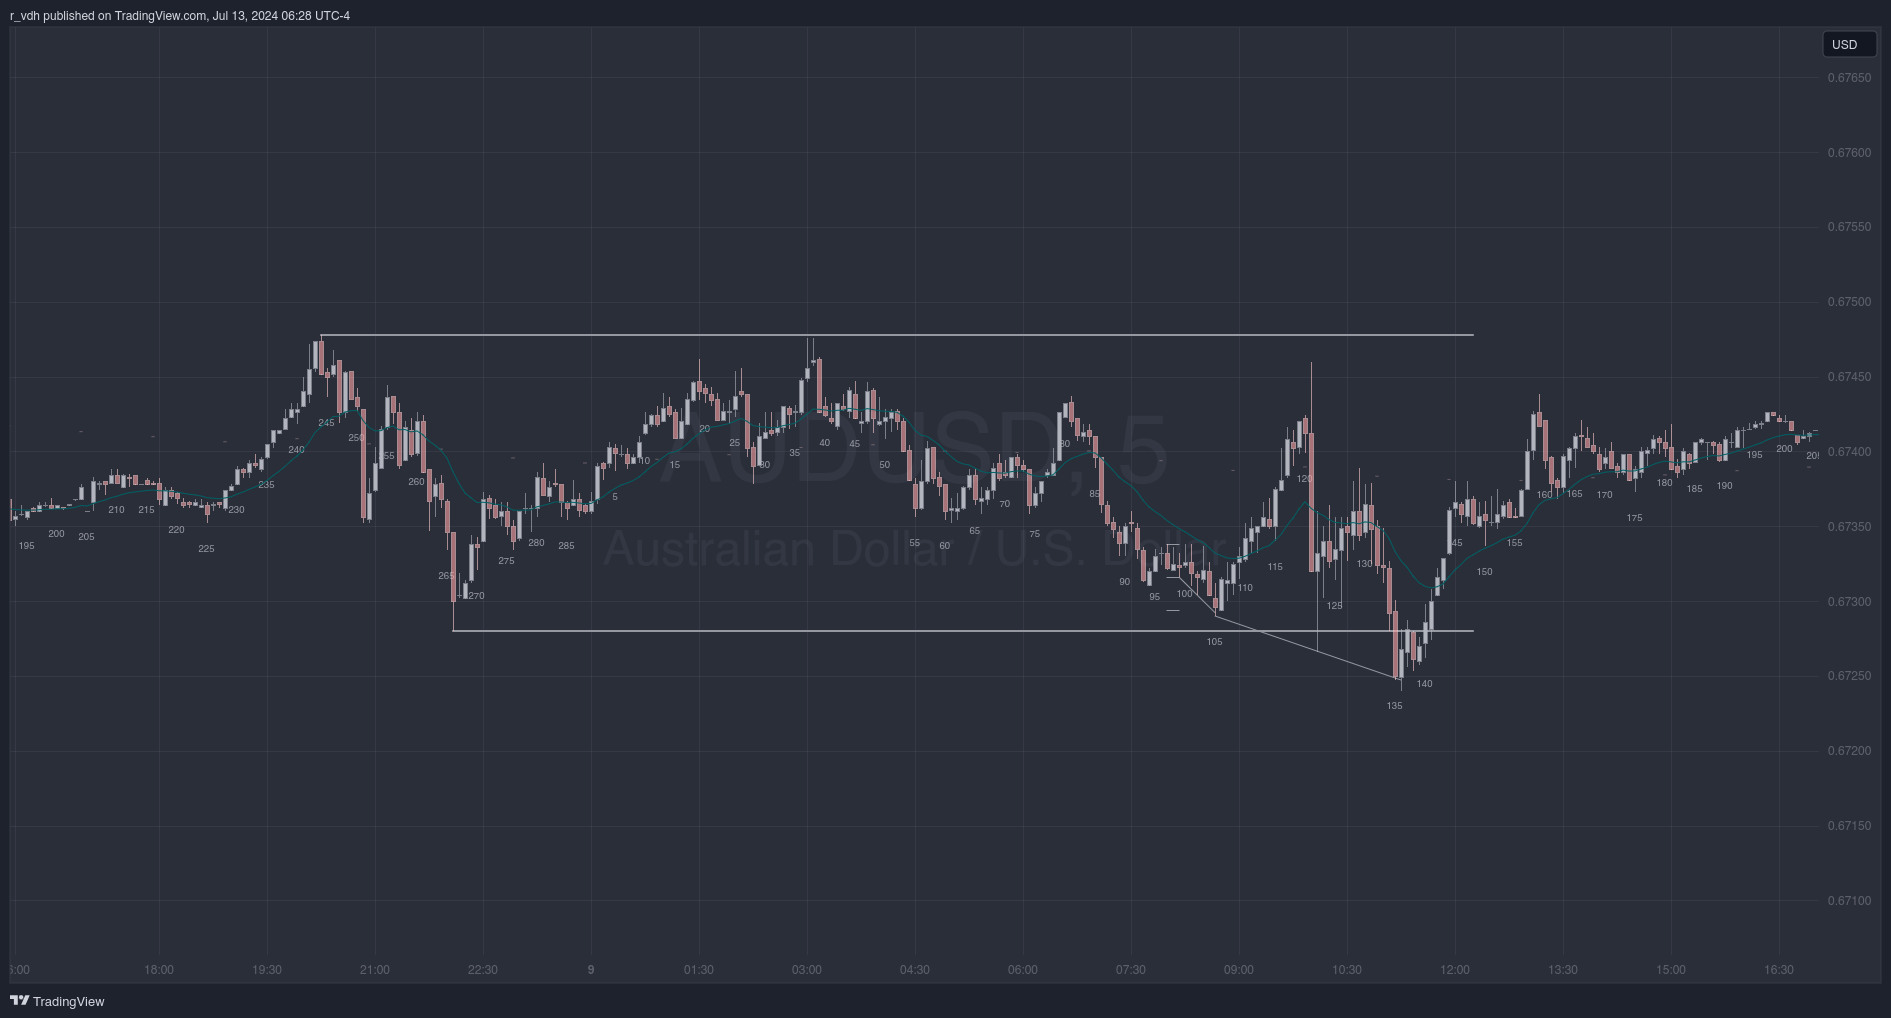
Al Brooks claims that the first bar of the session is also either its high or its low 20% of the time. This was the case today during the London session. It posted its high on the open at 3am ET - a double top with yesterday’s bar 244 - and spent the rest of the session moving down to the bottom of the trading range.
About three and a half hours later, there was a strong bull candle closing on its high at bar 79. Occurring in the upper third of the trading range, this was a good sell the close trade.
Barbwire is often the final flag of a bear trend, and a good long entry would have been to use a measured move based on the height of the barbwire trading range that took place from bars 96-100 to place a limit order buy order. The order would have been filled around the price of the bar 105 close, which was also a wedge bottom in the bottom third of the trading range.
Bar 137 would have triggered the buy for stop order bulls betting on the larger wedge reversal at the bottom of the trading range.
Wednesday, July 10
Analysis
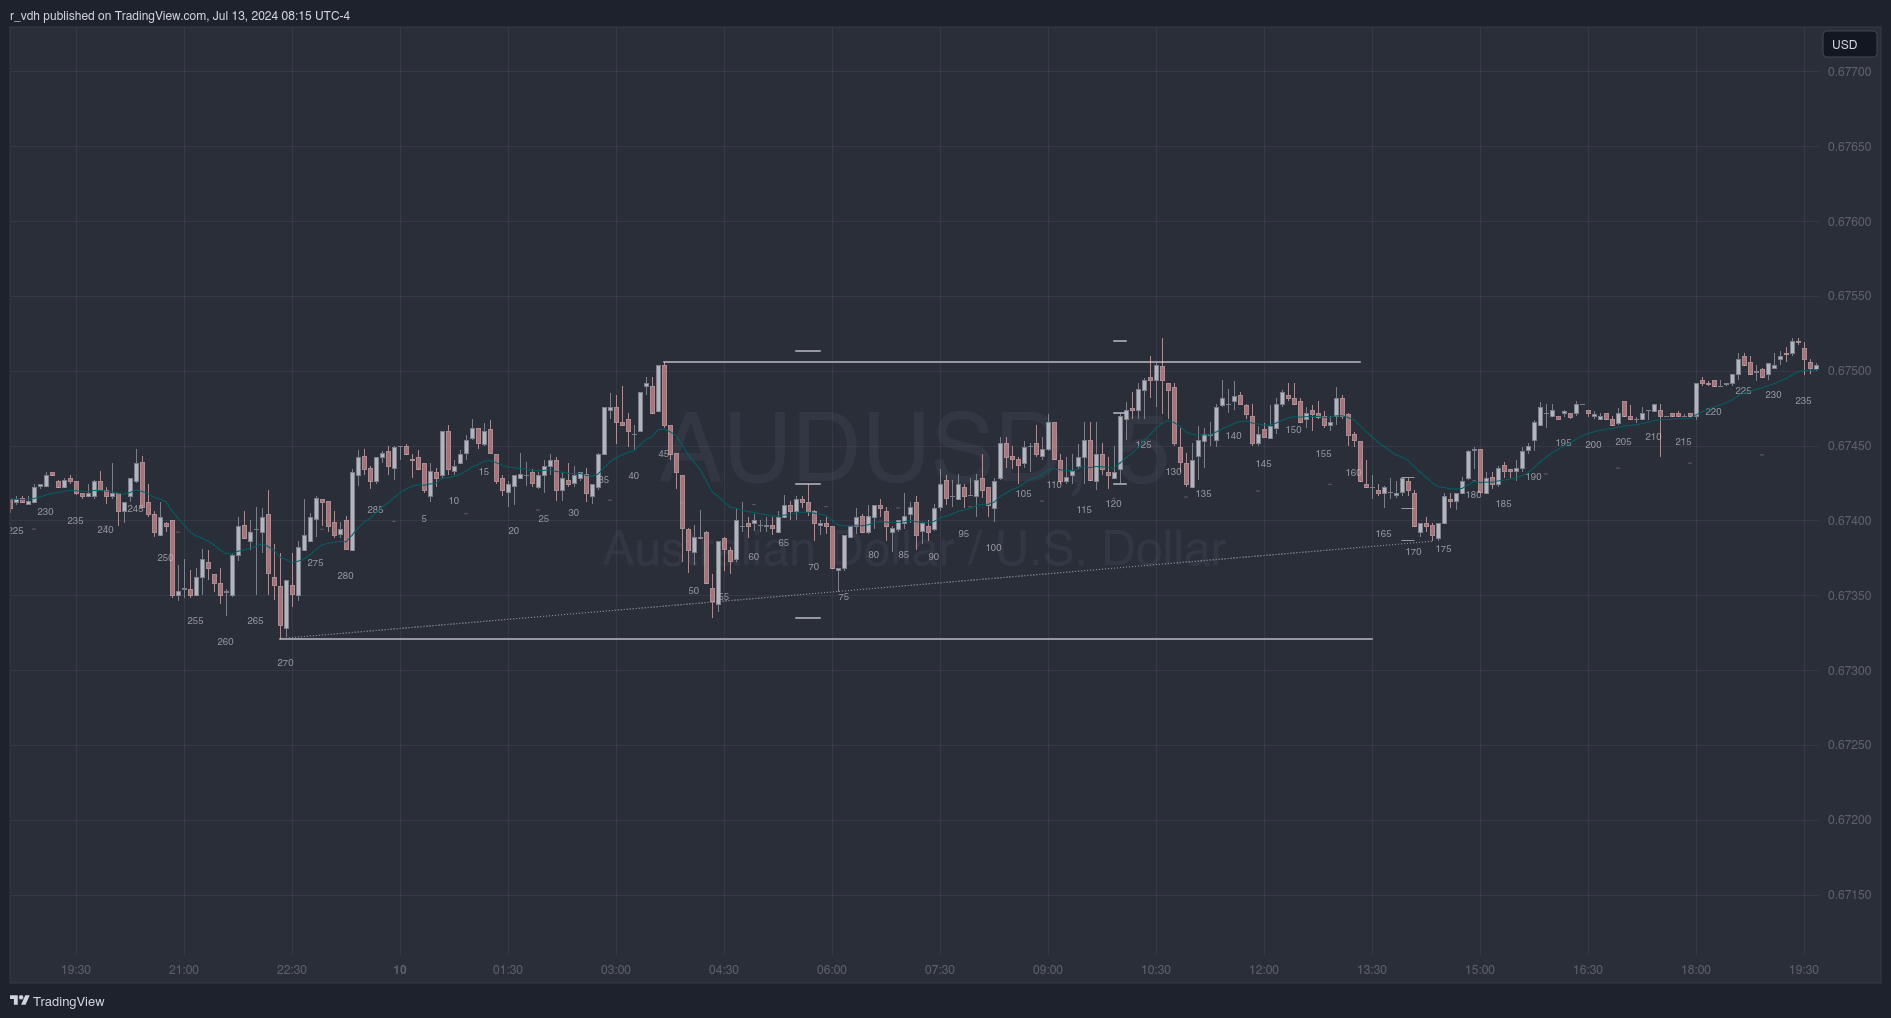
Today was another trading range day, but the bulls were beginning to gain control. Bar 52 made for an acceptable but-the-close trade, but there was second entry at the bar 74 wedge bottom signal bar. Taking the second entry trade was higher probability, seeing as it was both a second entry and it allowed traders to enter on a stop intead of using a limit order.
The bar 109 signal bar was not a clear enough wedge to justify shorting, at least on a stop. It hadn’t touched the top of the channel and there was also room left in the previous measured move projection. However, traders that sold the bar’s close with a stop loss that used a measured move (not illustrated) based on bar 100’s low and bar 109’s high were able to scalp a profit equal to their risk. These traders would have been selling in the top third of the trading range, and there trades were acceptable as lone as an appropriate stop loss was used. Bar 121 was another sell-the-close short, using the height of the move for a measured move projection. In this case, that would be either from the low of bar 119 to the high of bar 121, or the low and high of bar 121 itself.
The temptation to use a tight stop to short on a stop after the bar 126 signal bar - with the stop placed just above the bar’s high - would have proven costly. Notably, the price hadn’t made it up to the measured move projections. Also, it seemed probable that the move up from bar 121 should have formed a wedge, but bar 126 only constituted the second push.
Barbwire made an appearance around bar 165 as the final flag for the bear trend.
Thursday, July 11
Analysis
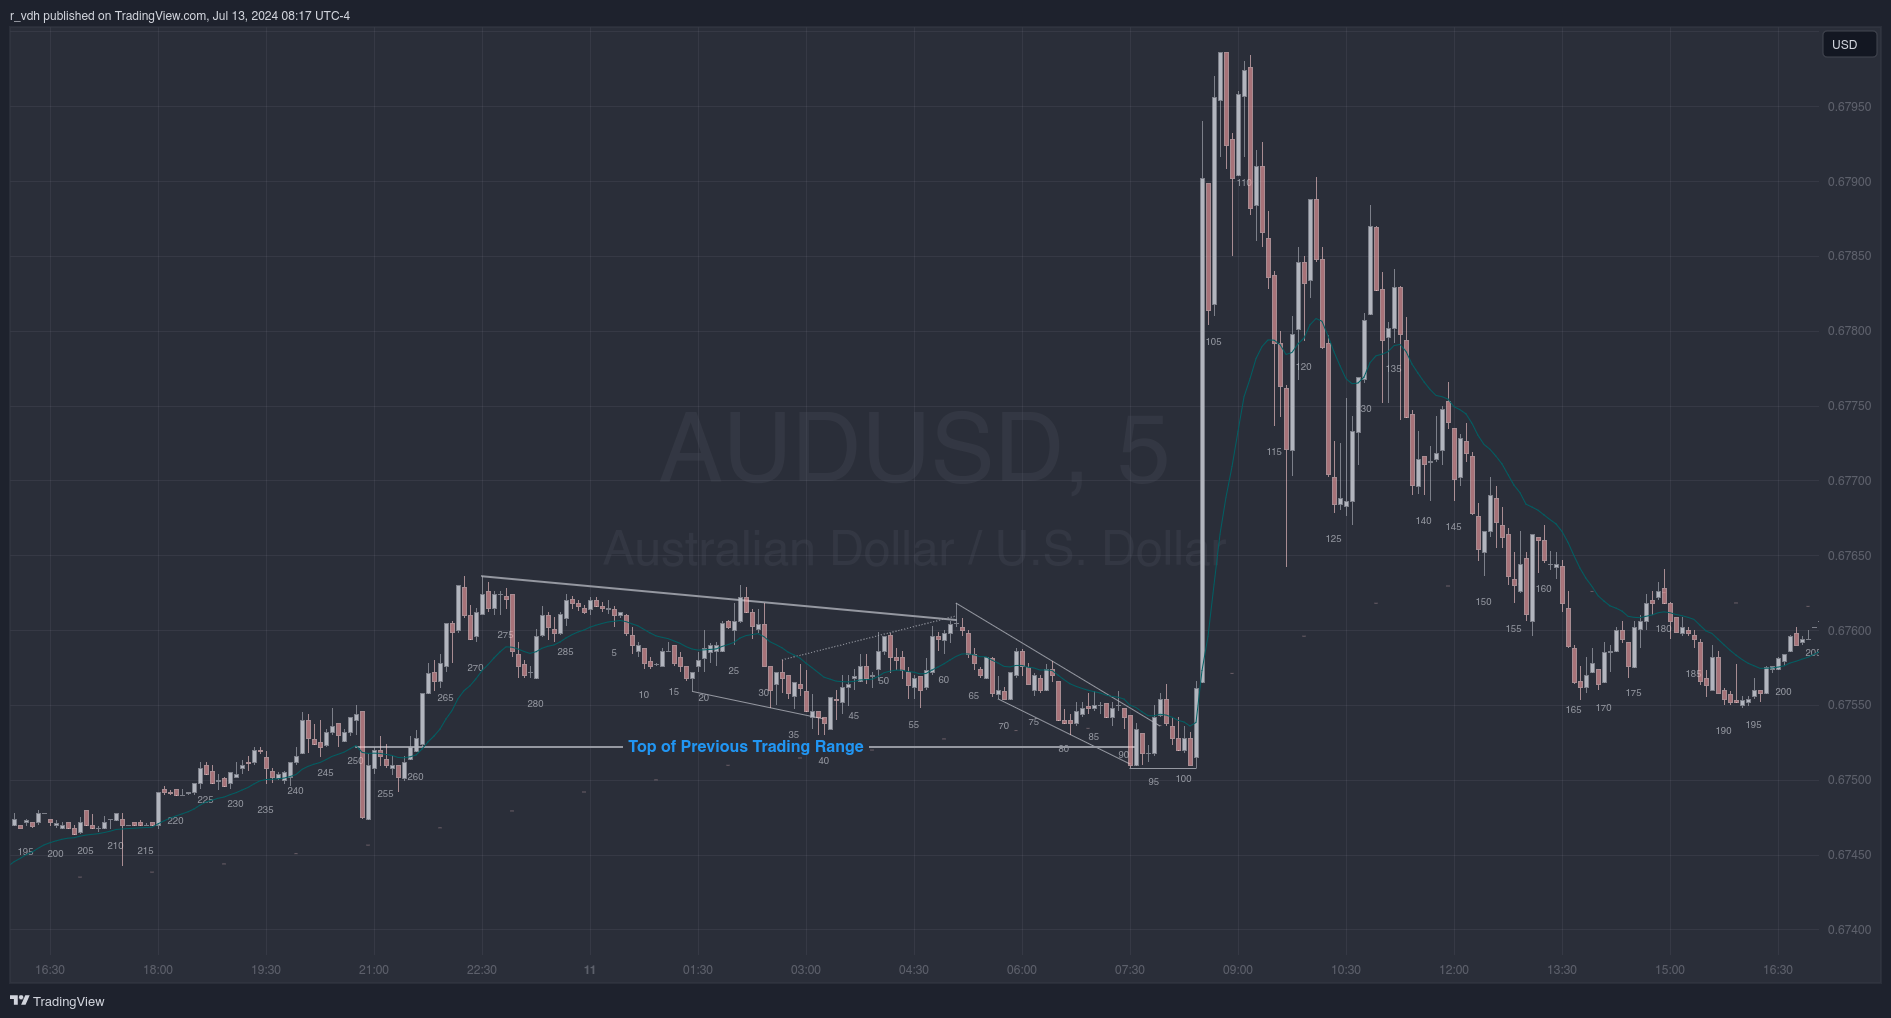
The price broke out from the trading range it had been it over The price had been in a trading range from Monday through Wednesday. It broke out of that trading range during the Tokyo session on Thursday, and the following London session consisted of a retest of the top of the previous trading range.
There was an opportunity to short the top of the wedge at bar 62 before the market turned down for the final bear trend before it broke out of it at the start of the New York session. There was then a wedge bottom (bar 91) at the top of the previous trading range, followed by an iii (bar 94), followed by a double bottom (bar 101). No moving average gap bar occurred, but the bar 96 trend line gap bar, in conjunction with the iii wedge bottom at support, justified a stop order buy as the market moved up past the high of bar 101.
Friday, July 12
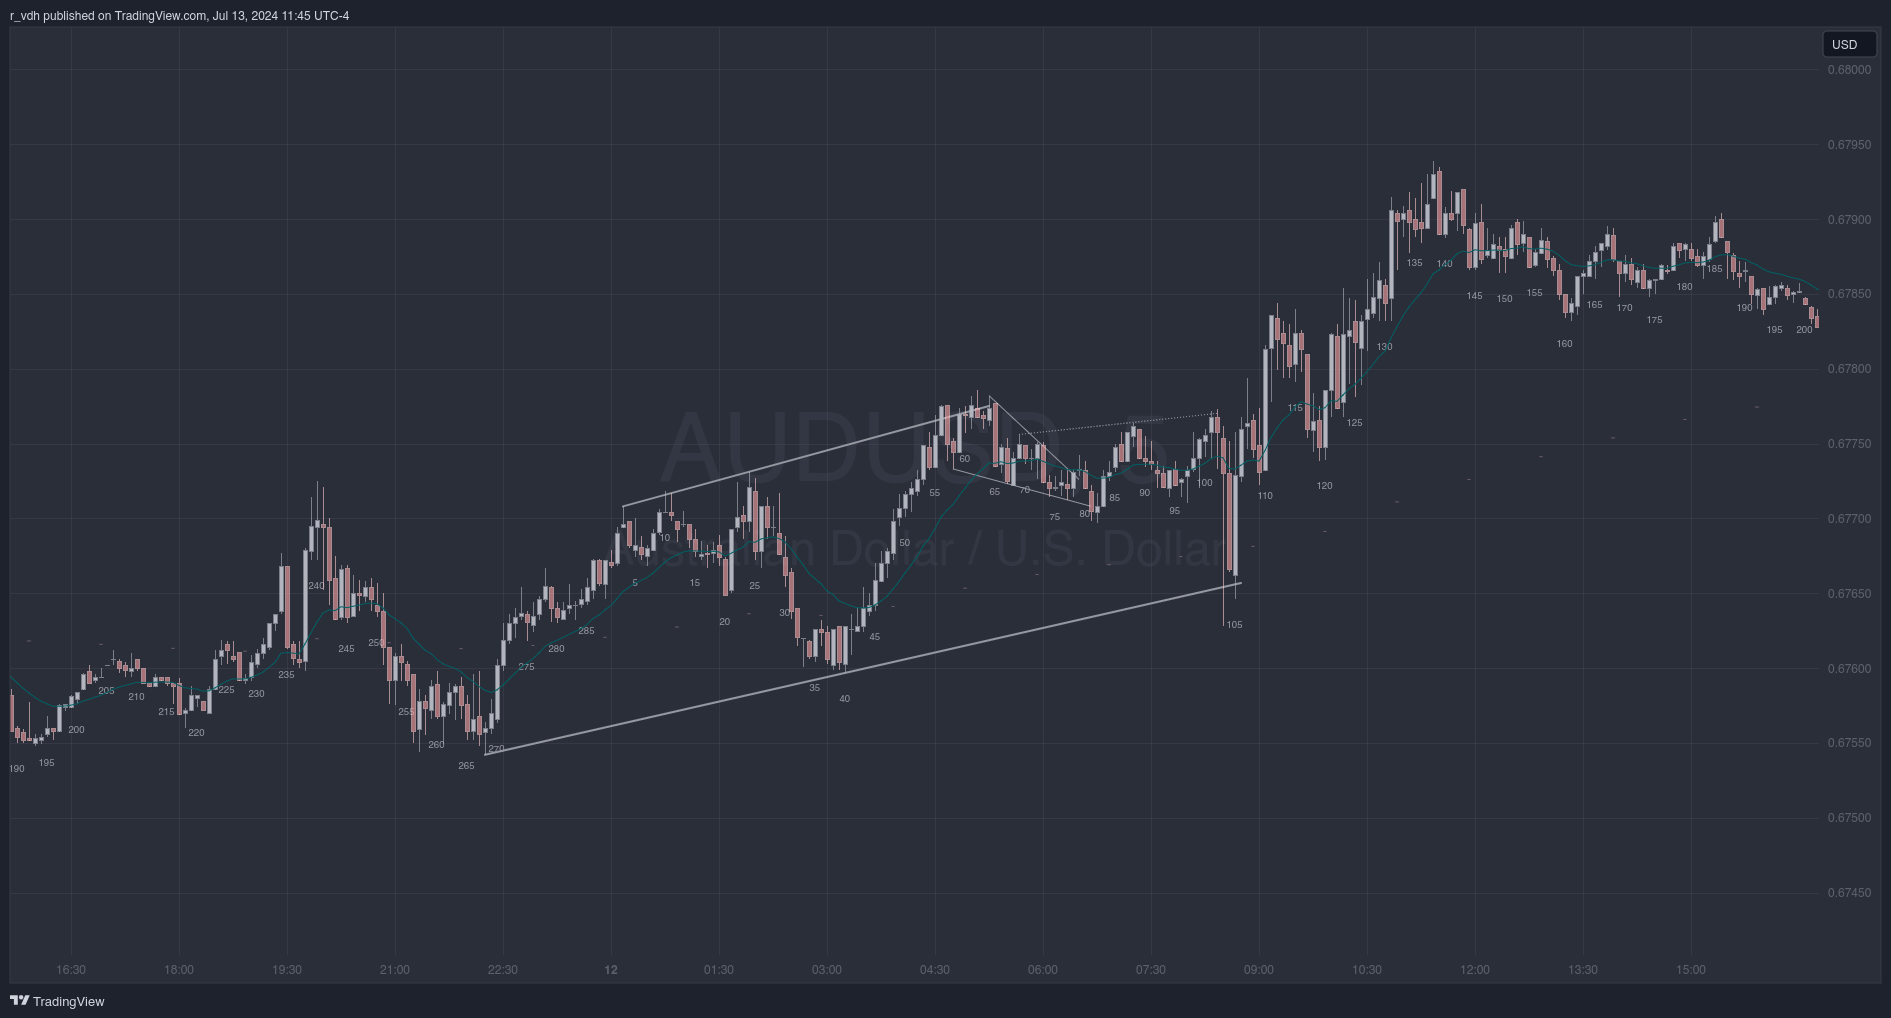
Analysis
The London session began with a spike up to bar 56. The market then formed a wedge bull flag followed by a wedge bear flag, before collapsing down to the bottom of the spike and then continuing higher. Bulls buying the reversal up at bar 82 should have placed their stop loss below the low of the bar 42 start of the spike.
Traders who took the bar 63 short would probably get out by bar 83, but could have re-entered their shorts after the bar 101 low three signal bar.