Monday, July 15
Analysis
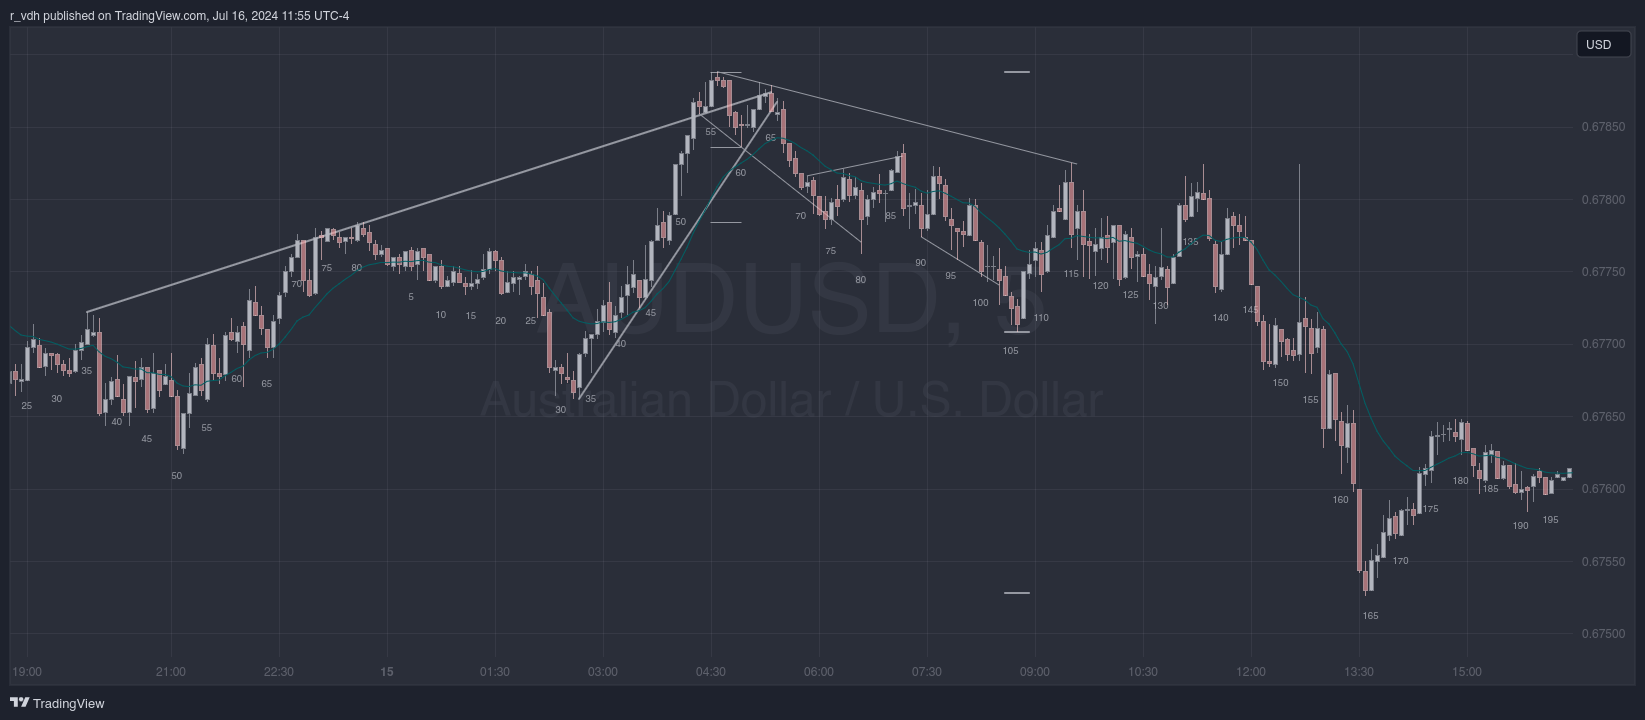
The London session high occurred eighteen bars in at bar 55. Most of the time, the high or low of the session occurs within eighteen bars of the start of the session (on the 5-minute chart), and seeing as this high occurred at the top of a large wedge, a trader might bet on a turn down. Additionally, the bars which followed represented a second attempt at a downturn - the first attempt being bar 53 - making the reversal more likely. For those waiting for a wedge to form, the third push came in at bar 63 and failed to close above the wedge’s trend channel line. Finally, a one-bar trading range formed beneath the trend line at bar 66 before breaking down below it into a leg 1 = leg 2 measured move.
A type of compound wedge formed at the measured move projection with the three pushes being bars 74, 80, and 84. Longs that entered on stops as bar 85 went above the high of the prior bar needed to be cognizant of the fact that there had not yet been a moving average gap bar, so getting out of their longs when the bars 71, 77, and 86 wedge began to fail would have been proper.
Bar 86 was the moving average gap bar (and was an acceptable short), and it gave bulls the confidence to try for a reversal at the bottom of the next wedge, at the beginning of the New York session. The reversal ultimately failed, and after three pushes (the highs of bars 115, 137, 153) continued down for a measured move based on the bar 55 high and the bar 106 low.
Tuesday, July 16
Analysis
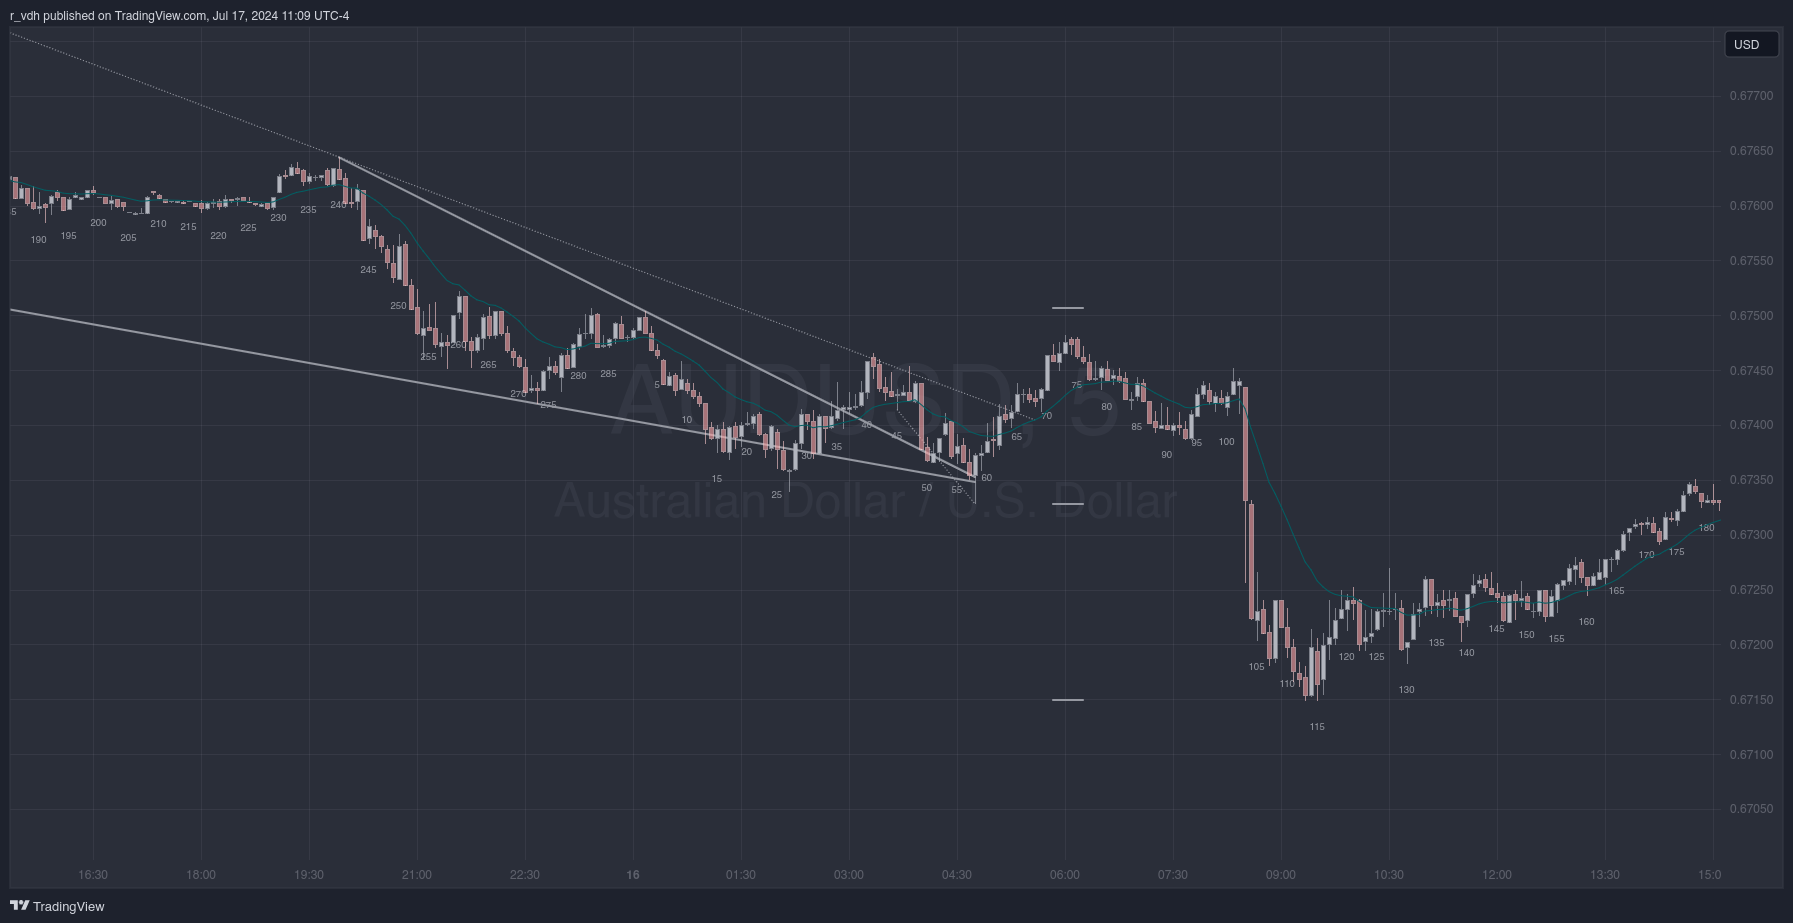
The end of the Tokyo session had shown climactic price action as the market dipped below the major trend channel line, and after the series of moving average gap bars starting at bar 35 you could expect a bullish attempt at a reversal.
The move up from bar 59 was an attempted lower low major trend reversal, which broke the next longer term trend line. It bottomed in a not-so-perfect wedge, the second push of which was a buy-the-close bar, being the best-looking bear bar of the whole trend and occurring so late in the trend. Basing a measured move off of that bar and using the projection as the stop loss for a long would have been a good idea. Ultimately, the market crashed down at the start of the New York session for a measured move based on the height of the trading range that it had been in for the previous 75 bars.
Wednesday, July 17
Analysis
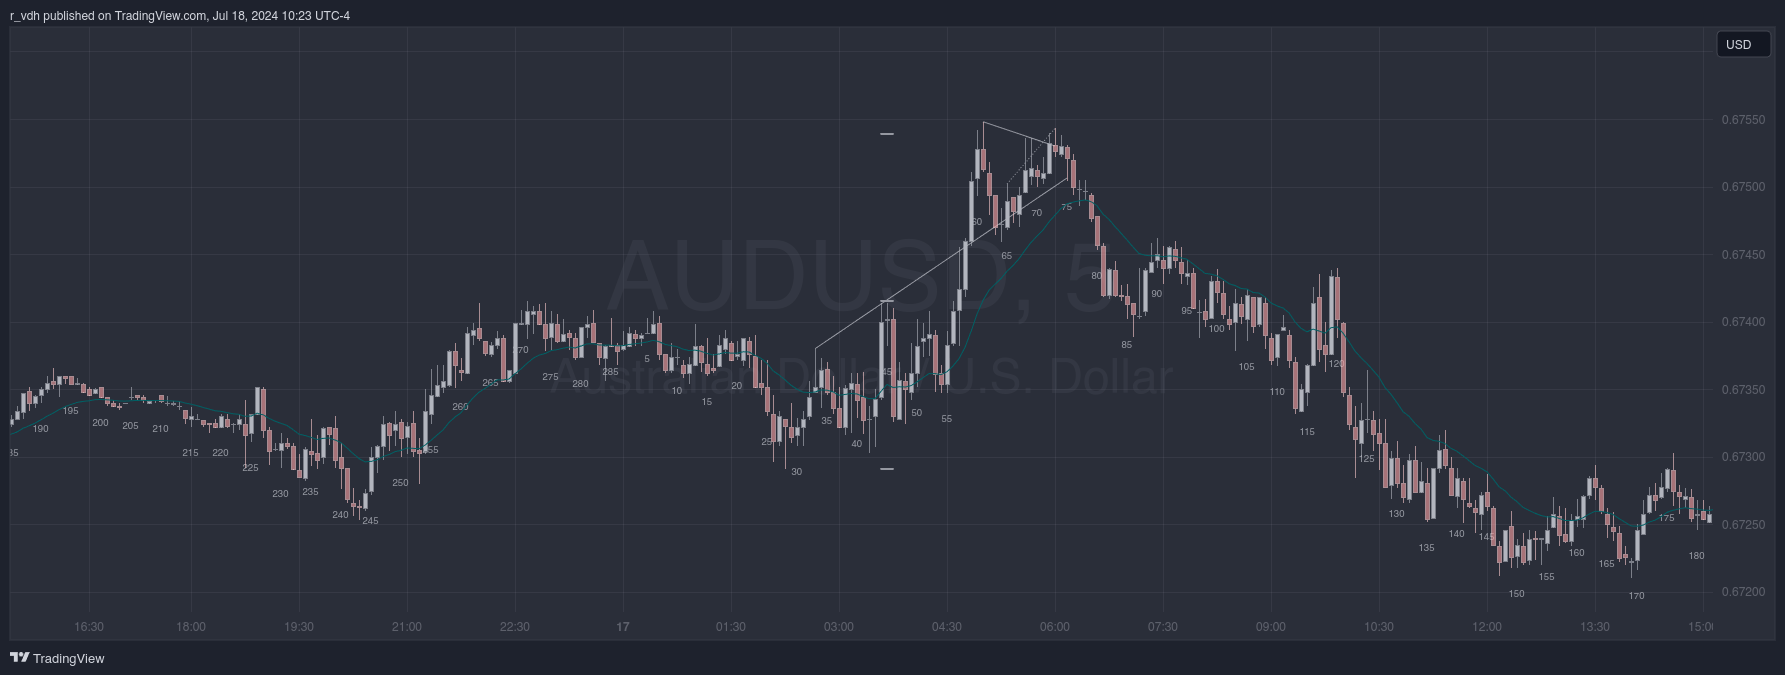
The market broke out of the trading range it had been in for about 80 bars shortly after 4:30 ET in a bull spike that lasted for six bars and an approximate measured move based on the height of the trading range. Around the middle of the spike at bar 57 it looked as if it could be forming a wedge top at the top of the trading range, but the third push failed to fail and the market formed another wedge on top of this one. This wedge failed and the market began its reversal which would continue through the New York session. Some traders would view the bar 61 top as the first push of the wedge (which took the form of a triangle), and bars 68 and 73 as the second and third push. Others saw the highs of bars 65, 69, and 73 as being the more appropriate wedge. Either way, the short would be entered at the same time, as bar 75 dipped below the low of the prior bar.
Incidentally, there was a longer term trend line (not shown) which could have been drawn, and bar 76 along with the inside bar that came after it, failed to close above it. If drawn, this line could have generated a short on the bar 79 break below the low of the prior bar.
Thursday, July 18
Analysis
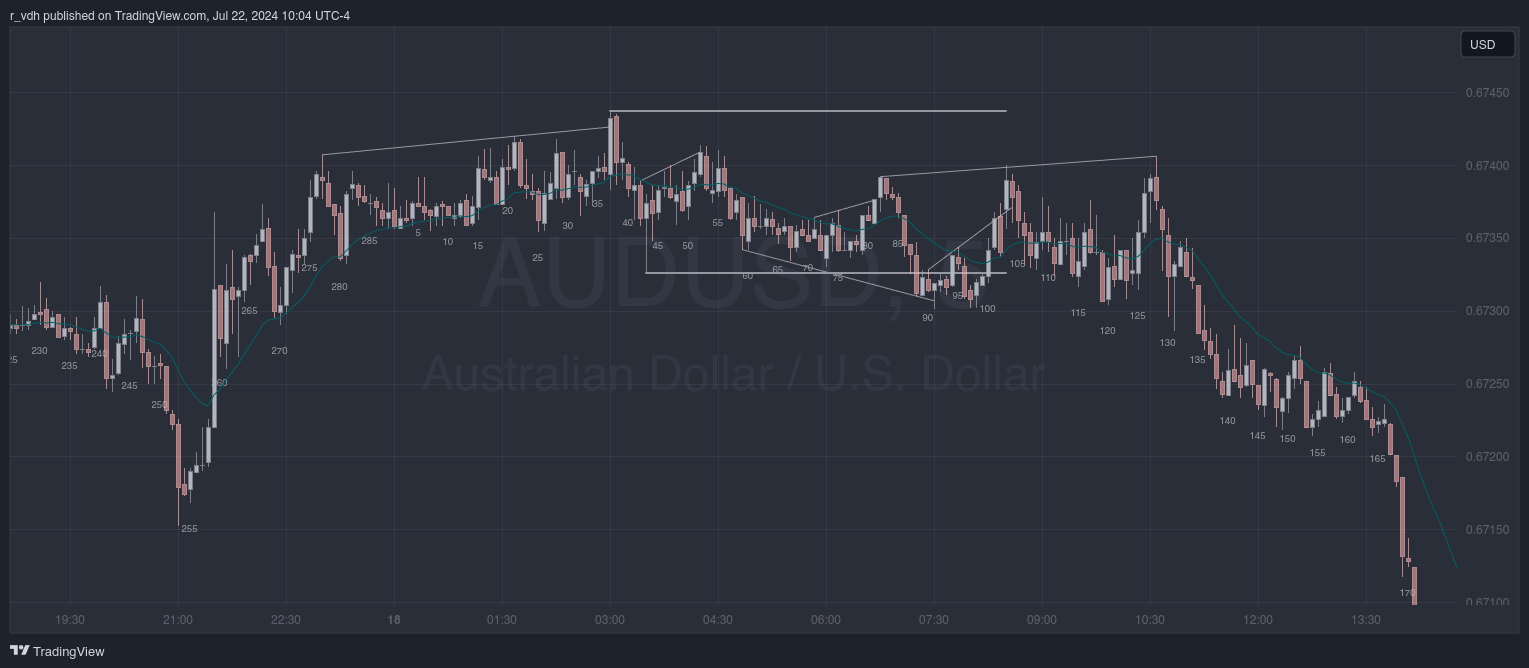
The market was in a trading range for the entirety of the London session today. Generally, you need to have a profit target of at least 10 pips in the forex markets in order to take a trade, and seeing as the distance from the top of the range to its bottom was only 11.1 pips, it would be difficult to find trades with that profit target, though there were a few.
It is noteworthy that while today’s price action was in a tight trading range, that range itself was part of a much larger trading range which it had been in since Tuesday morning. The first bar of the session at 3:00am ET was in the top third of that larger trading range, as was the bar 52 wedge top. A trader willing to use a wide stop loss could have taken these trades, but may have been better off trading on a higher time frame chart.
As far as trading the chart that is in front of you goes, the aforementioned bar 52 was a low 3 signal bar which triggered with the following bar. It was also in the upper third of the trading range, and while the distance to the bottom of the range was less than the generally required 10 pips, it would have been a profitable trade nonetheless.
Bar 90 was a second entry reversal and an attempted break out of the trading range. It also poked through the bearish trend channel line, which is climactic behaviour. The top of the trading range could have been used, which at this point was over 10 pips away. By all accounts it was an acceptable trade, as was the double bottom which occurred six bars later. The market never made it to the top of the range, but traders could have scalped out near the top of either of the ascending wedges which formed subsequently. There were multiple wedge tops and bottoms which formed in the upper and lower thirds of the trading range. While the price ultimated never touched the top of the trading range before breaking down, none of the trades should have lost a trader money, provided the correct stop loss was used. Even though none of the trades reached a full 10 pip stop loss, traders that scalped out at the appropriate times could have ended the session having made around 20 pips all in all.
Friday, July 19
Analysis
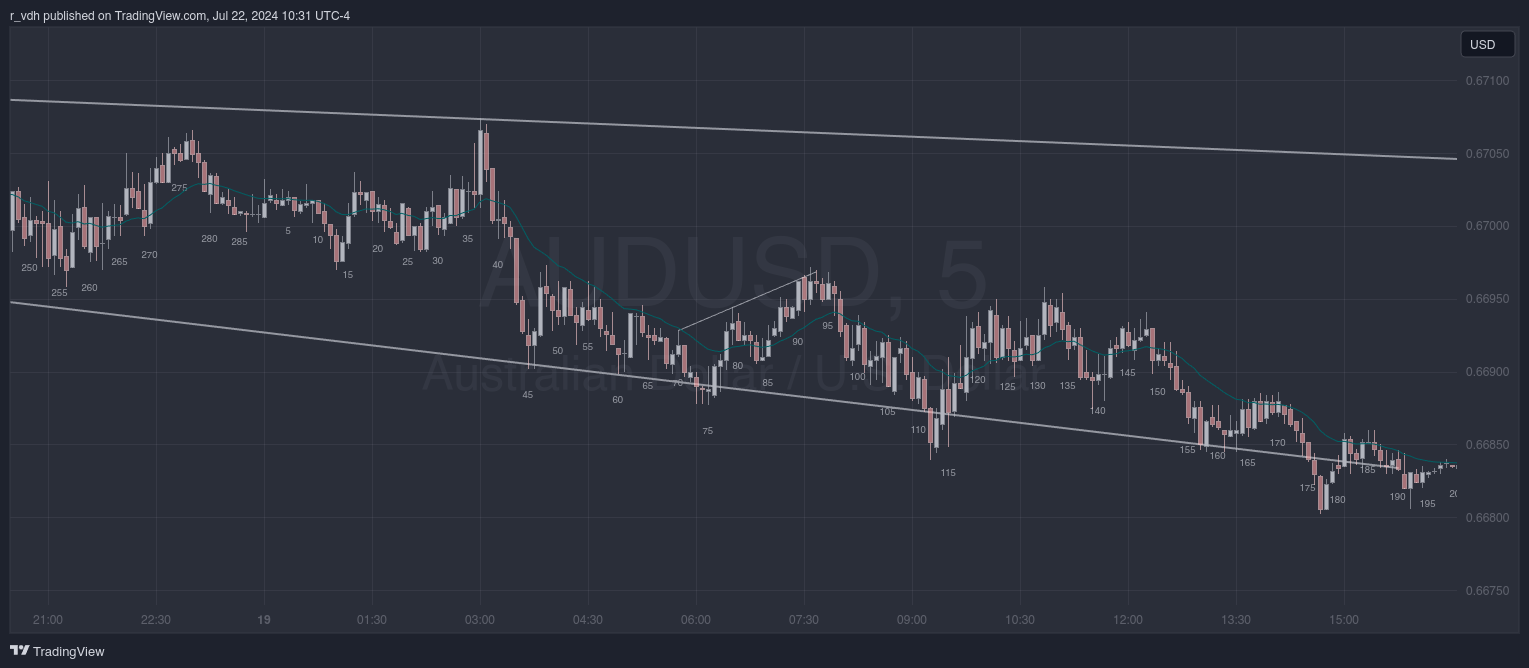
The London session started with a climactic bull bar up to the top of the sideways-to-bearish channel it had been in since the day before. It then made a spike down to the bottom of the longer-term channel the market was in. The spike formed its own smaller channel at the bottom of the larger channel, each leg of which was itself a wedge. Bar 74 was a high 3 signal bar with price action that had poked below the bottom of the larger channel, which is climactic, and longs could be entered on the following bar as the market turned upwards. The reversal formed a wedge top at bar 87 which was non-climactic; the bears only succeeded in turning the market back down about 10 bars later after the formation of a triangle on top of that wedge.
The bar 95 third push of the wedge presented an opportunity to short down to the bottom of the channel. Traders would sell on stops on the following bar and any open longs from the bar 75 trade should exit at this point as well. The appropriate stop loss for the shorts was above the bar 39 top of the spike. The bar 112 low would not have given those traders a reward equal to their risk. Nevertheless, it was a climactic wedge bottom, and the traders should buy back their shorts by the time bar 114 went above the high of the prior bar and the move began to reverse.