Monday, July 22
Analysis
The London session consisted of a relatively tight trading range (less than 10 pips). There was a low 3 setup at the bar 61 top of the trading range, which created a high-3 setup when the move reached the bottom of the range. The resulting move from the high 3 made it into the top third of the range and then proceeded downwards and broke out the bottom of the trading range.
Most trading ranges break out in the direction of the trend, and this one was no different.
The first candle of the New York session, bar 103, was a large bear trend bar after a low 2 near the moving average.
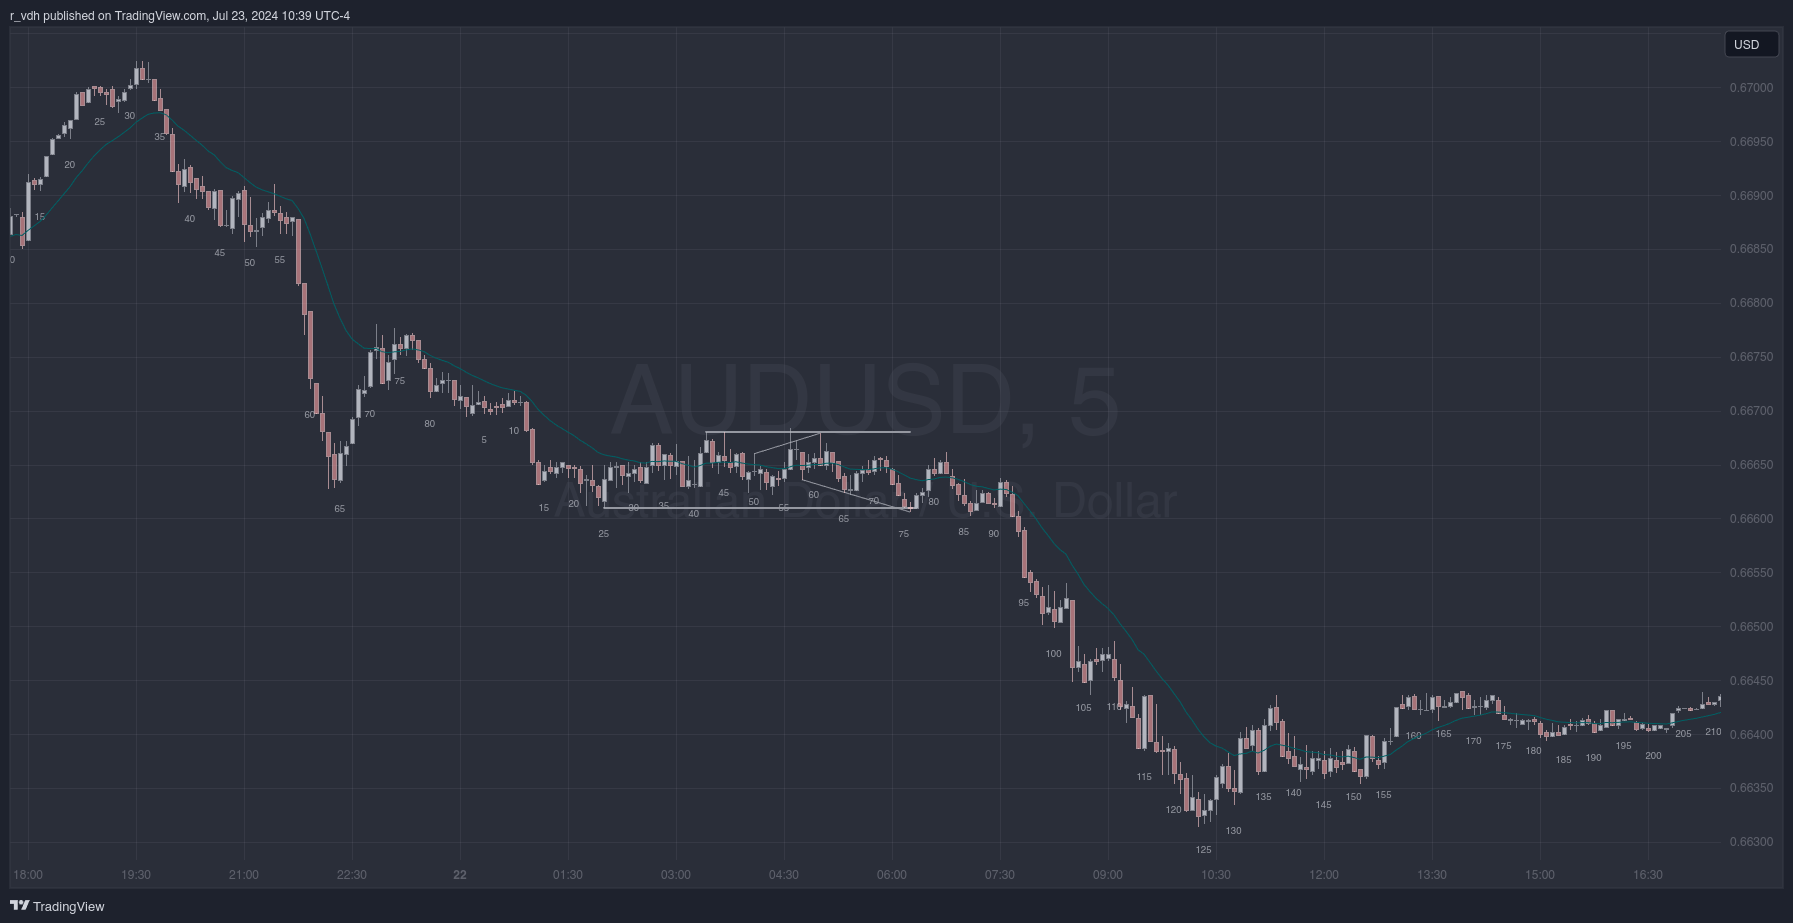
Tuesday, July 23

Analysis
There was a spike and channel correction within the ongoing bear trend. The spike started at bar 51 and the tops of the two pushes of the channel were bars 71 and 87. The spike was strong enough to create the first moving average gap bar since about 60 bars, and the channel that followed was the bulls’ attempt at a reversal. However, the trend was too strong and was resumed by the bears. Since there was a moving average gap bar and some climactic price action (bars 31, 45, and 50), longs could have been entered as bar 62 went above the high of the prior bar, or perhaps on the bar 65 second attempt. However, in a trend this strong, it would be better to only take shorts.
Bar 72 was an inside bar after a wedge top, and the short triggered on the following bar. But the trend line had just been broken, so the market was likely to retest the line before attempting another push up. Also, there hadn’t yet been a second push from the earlier spike.
Bar 86 was a poke above the trend channel line, as well as being the second push of the channel. And it was followed by a good reversal bar. Shorts could be entered on the following bar. Regardless of weather shorts were entered here or after the bar 71 low 3, the appropriate stop loss would have been above the bar 25 high.
Wednesday, July 24
Analysis
The market was in a broad bull channel from bar 3 in the Tokyo session until bar 144 in the New York session, and shorts could be taken as well as longs. There were many wedges, the majority of which would have generated profitable trades. Bar 65 was a climactic wedge bottom after the wedge top at bar 40. The wedge correction had not yet seen a moving average gap bar, so more cautious traders would have waited before entering. The reversal from the wedge came in the form of a spike which managed to achieve multiple moving average gap bars. There was then a high 2 signal bar at bar 82. The third push down at bar 86 did not achieve a nice wedge shape, due to the bullish momentum. Bulls who were waiting for a third push needed to be happy with that bar, as it was their last chance to get long before the trend resumed up.
The end of the channel made a double top with the previous session high at bar 40, and then spiked down and up a few times, forming a head and shoulders at the trend channel line, from which it descended for the entirety of the New York session.
The most fitting trend channel line was drawn as a parallel of the trend line, and then snapped to the top of the spike at bar 22.
Thursday, July 25
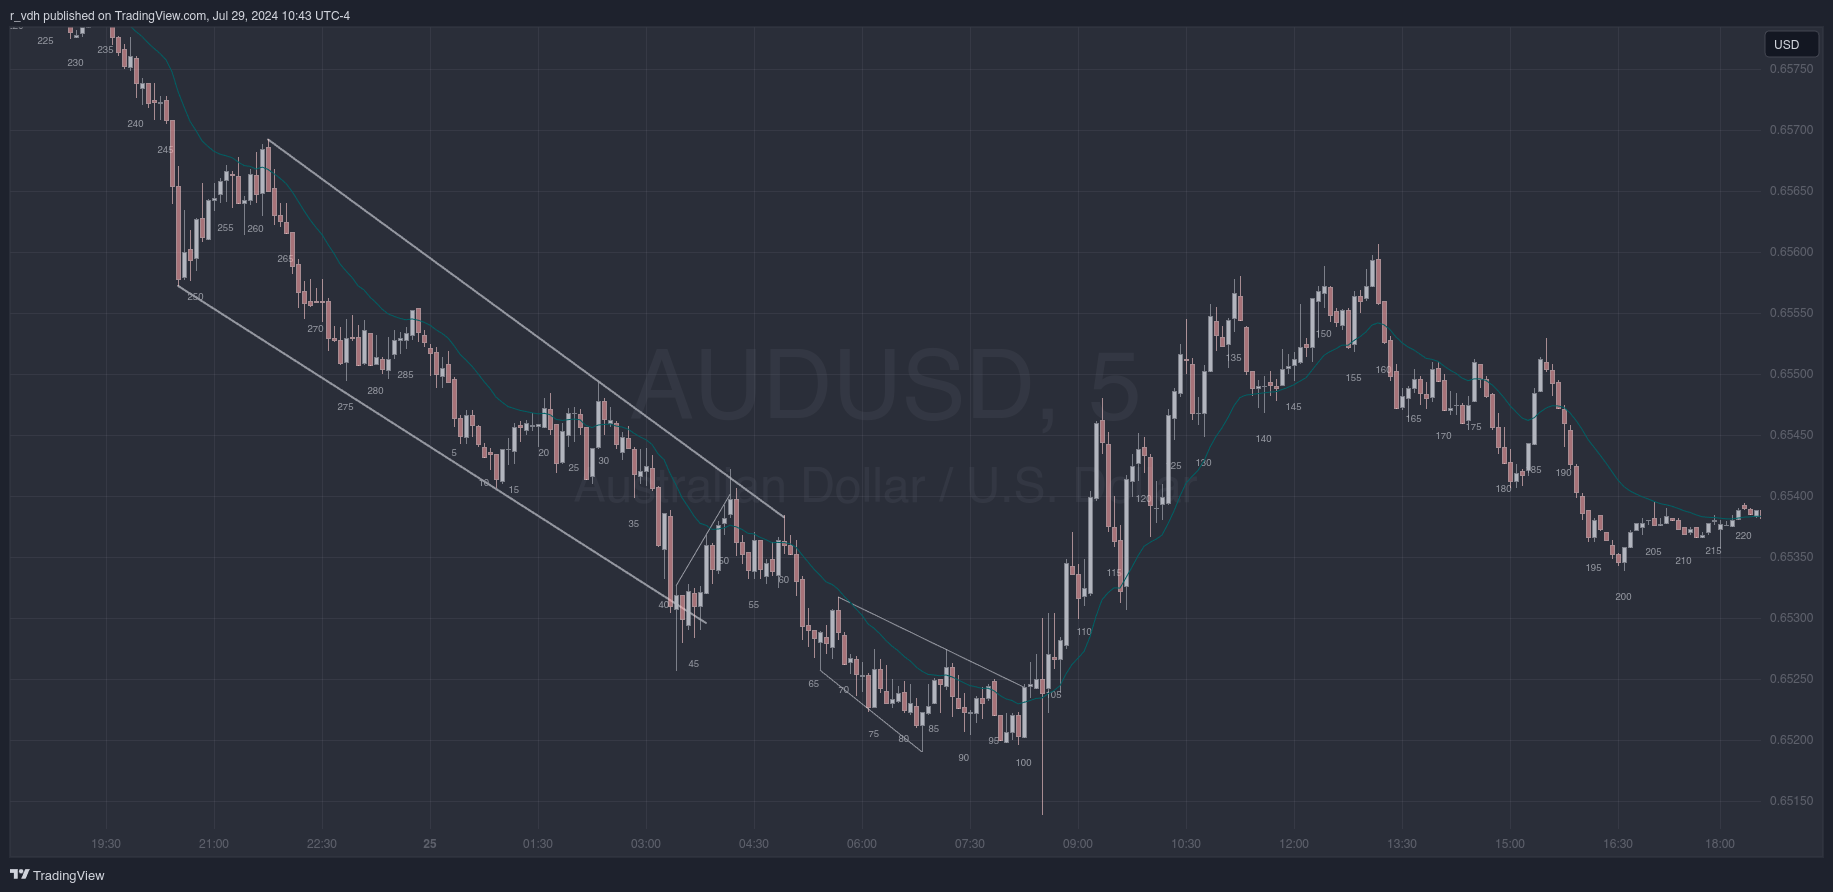
Analysis
The strong bear trend formed a moving average gap bar at the bar 51 low 3 signal bar, which being the first moving average gap bar is usually good for another push down, as it was here.
The wedge that then formed between bars 66 and 83 was tempting to trade as a lower low major trend reversal, due to the moving average gap bar which had taken place. However, a clean break of the trend line is usually required before a reversal can take place. The attemped wedge reversal then transformed into a trading range, and after beginning to break out of the wedge, bar 103 crashed down below the wedge low before resuming the trend up. Notably, bar 103 was the first bar of the New York session.
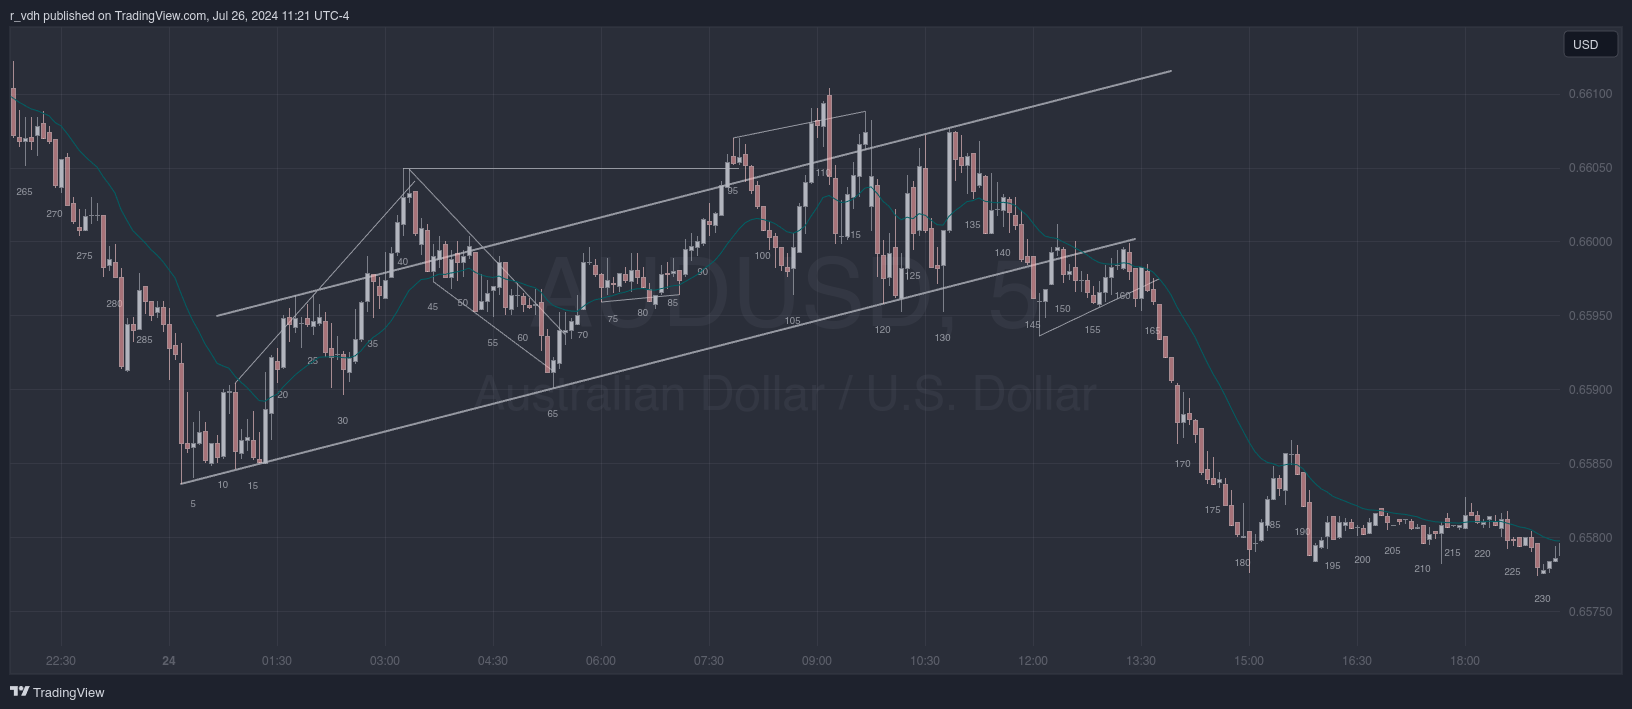
Friday, July 26
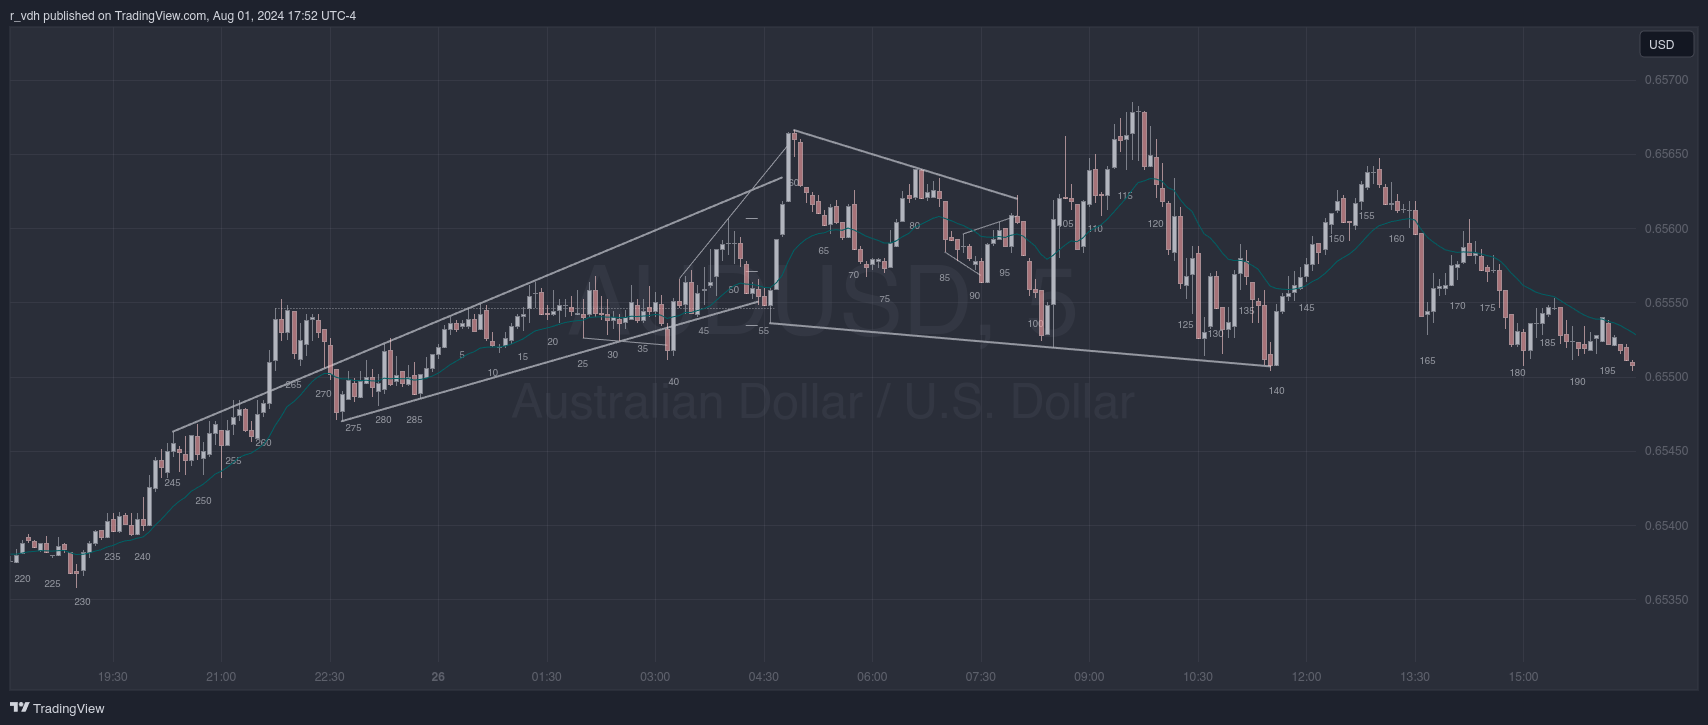
Analysis
We were in a tight bull channel at the London open, though not an especially strong one. In tight bull channels traders should only be looking to buy. So when a high 3 signal bar appeared at bar 39, longs could be entered on the following bar when it triggered. But where to place the stop loss? One option is to place it right below the bar 39 low. The bar did poke below the minor trend channel line, which is climactic, so odds are that there would be another leg down before the trend resumed up. However, the more conservative placement for the stop loss was below yesterday’s bar 273. This was the start of the channel after the spike up.
Wherever the stop loss was placed, when the market began to move down again after bar 49, longs needed to decide whether or not they wanted to stay in. After all, it was a low 3 (or possibly a low 4 - depends on who’s counting) after a moving average gap bar. A few things pointed to the likelihood of having another move up:
- the move between bars 40 and 49 was tight, and therefore less likely to be the beginning of a reversal
- bar 40 had not reached the best fit trend channel line, so was not climactic
- there was still room left in the measured move (not shown) based on the bar 259 spike
Also, the bar 56 low was a measured move target based on the gap between bars 51 and 53, and that bar was a good bull reversal bar, and the bar before it closed at the top of the original spike at yesterday’s bar 262.
A triangle formed after the climactic spike up, and presented a short opportunity after its third push up at bar 97.